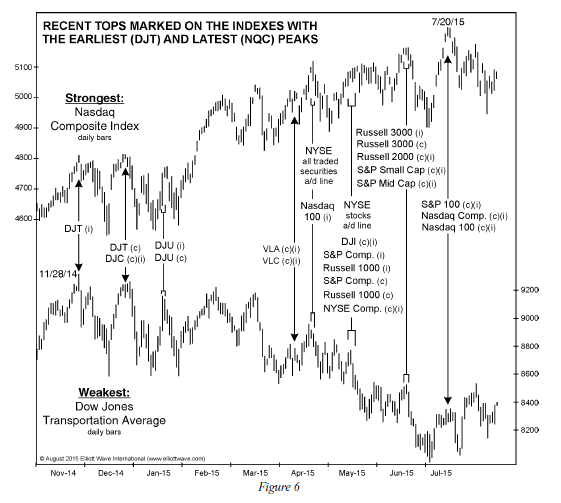
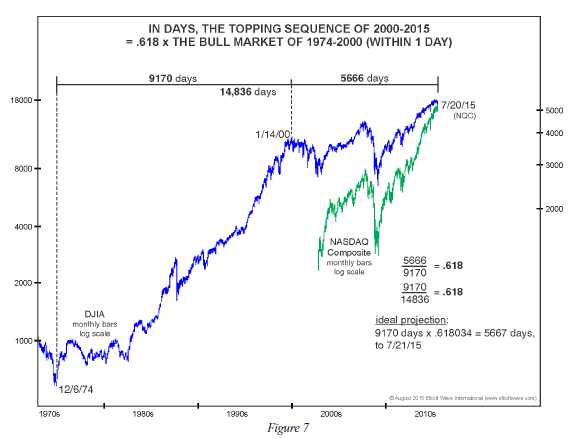
The complex topping process in the US equity markets over the last several months is depicted in what I have labelled graph two below. The markets now appear to be falling hard after a final peak of some major indexes including the Nasdaq composite on 20/7. Graph One show that 20 July is linked by the phi ratio to major market turning points in 1974 and 2000 (the appearance of these ratios is a key element of Elliott Wave Theory)
Stock market crashes often climax 55 days after a significant peak. This famously was the case in both 1929 and 1987. Guess what the date is 55 days after 20 July 2015 ??!!
Blessings,
winston
Graph One
Graph Two